BEERS stack
The clickable diagram below depicts the main components of the stack. Bucket is used for storage of input and output data. State machine is used to start and monitor the pipeline execution. Batch dashboard can be used to monitor executions of individual jobs.
Running the simulation pipeline
We present both GUI and CLI instructions for running the pipeline. To execute CLI commands you can use the cloud shell which comes with AWS CLI, or you can install and configure AWS CLI on your own computer.
Input and configuration
Input data and configuration YAML file need to be stored in the bucket. There are several ways to accomplish this. If the files are not too big you can simply drag and drop them in the bucket. For larger files you can use AWS CLI, which we illustrate next.
First download and unpack the example. Execute the following command on your computer or in the cloud shell:
curl https://s3.amazonaws.com/itmat.data/BEERS2/examples/baby_mouse_example.tar.gz | tar -xz
You may want to inspect the structure of data and the configuration YAML file in the example. Then upload everything to the bucket:
BUCKET={{BUCKET_NAME}}

aws s3 sync baby_mouse_example s3://$BUCKET/examples/baby_mouse_example
Starting execution
GUI
Open the state machine GUI and click the start execution button. You can specify the name of the execution or use the auto-generated UUID. Provide the following JSON as input and then click the start execution button:
{
    "directory": "/examples/baby_mouse_example",
    "configfile": "baby.config.yaml"
}
Notes
File and directory paths specified in the input JSON and in the configuration YAML file refer to objects stored in the bucket. These paths can be absolute or relative:
- The root
/in absolute paths corresponds to the storage bucket itself. - Relative paths will be prefixed with
directoryspecified in the input JSON. Ifdirectoryitself is relative, it is made absolute by prefixing it with/.
The simulation results will be placed in the directory. Default directory is the storage bucket /.
Recommended way to specify file and directory locations is to use absolute paths both in the input JSON and in the configuration YAML file. To specify the location of final results you can then use directory argument. In our example, the configuration YAML file uses relative paths, so appropriate directory had to be specified, as we did above.
Besides directory and configfile, input JSON can contain other arguments which will be passed down to Snakemake. Here is the list. For example, jobs can be used to limit the number of jobs running at the same time (default is 200). If your AWS account or region have too restrictive quotas on the number of CPUs that can be provisioned at the same time, you can ask for these quotas (for M type of instances) to be increased.
Note that when specifying the final argument in the input JSON, you must not put comma at the end. This is because JSON disallows trailing commas.
CLI
You can use the following command to start the execution. Execution name can be set with the --name argument, otherwise it will be UUID.
STATE_MACHINE={{STATE_MACHINE_ARN}}

aws stepfunctions start-execution --state-machine-arn $STATE_MACHINE --input \
'{
    "directory": "/examples/baby_mouse_example",
    "configfile": "baby.config.yaml"
 }'
Monitoring execution
GUI
Once you click the start execution button (or when you click the appropriate execution name here), you will be presented with the execution flow chart:
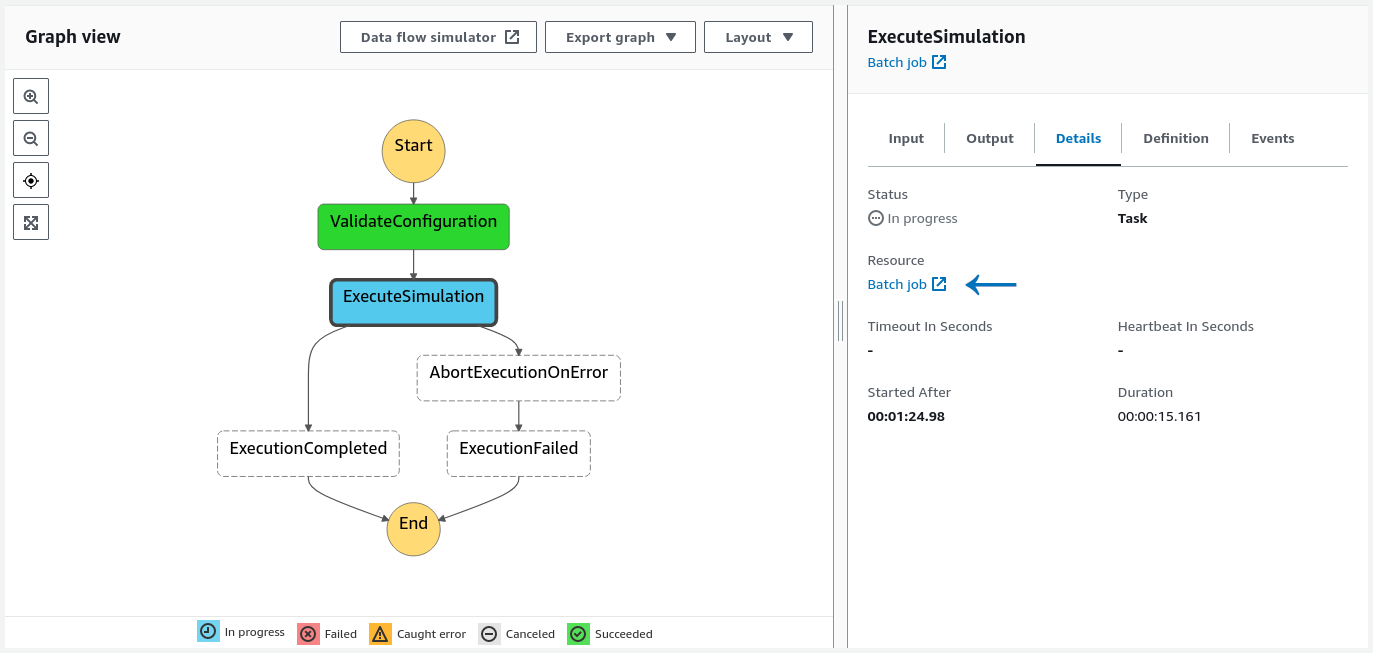
When you click on a particular step in the graph view, the details of that step will be shown in the right pane. Batch job link, indicated in the image above by arrow, can be clicked to further inspect the job corresponding to the step. Probably the most important information will be the link under the log stream name which will redirect you to the job’s log.
Execute simulation is the second and most important step in which Snakemake orchestrates the BEERS pipeline. Snakemake will submit jobs to the job queue, and the status of these jobs can be inspected in the Batch dashboard:

Clicking on the number counting the jobs in specific state (see the image above) will redirect you to the list of jobs in that state. At that point you can click on the job name to inspect job’s details. Probably the most useful information is contained in logs, which can be accessed by clicking on the link underneath the log stream name.
Notes
Control queue is used for running the Snakemake orchestrator and configuration verification procedure. Job queue is used for jobs submitted by Snakemake.
Jobs older than one week will be removed from the list of jobs.
If you wish to monitor the cluster performance, including the number of running EC2 instances (cluster nodes), CPU utilization, memory utilization, etc., you can go to your compute environment, click on the container insights tab and enable metrics. This will incur a small cost of about $3 monthly, until disabled, or the stack is removed. No data will be shown if no job was running during the selected time range.
CLI
This requires some proficiency with AWS CLI. We present two examples. In the first example we show how to monitor output of the Snakemake orchestrator.
We first need to determine the job ID of the simulation step (the second step) in which Snakemake is running:
STATE_MACHINE={{STATE_MACHINE_ARN}}

LATEST_EXECUTION=$(
    aws stepfunctions list-executions --output text                                                 \
        --state-machine-arn $STATE_MACHINE                                                          \
        --query executions[0].executionArn                                                          \
)

EXECUTE_SIMULATION_STEP=$(                                                                          \
    aws stepfunctions get-execution-history                                                         \
        --execution-arn $LATEST_EXECUTION                                                           \
        --query events[].taskSubmittedEventDetails.output | jq -r ".[1] | fromjson | .JobId"        \
)
Now we can monitor Snakemake output in real time:
EXECUTE_SIMULATION_STEP_LOG=$(                                                                      \
    aws batch describe-jobs --output text                                                           \
        --jobs $EXECUTE_SIMULATION_STEP                                                             \
        --query jobs[].container.logStreamName                                                      \
)

aws logs tail /aws/batch/job --log-stream-names $EXECUTE_SIMULATION_STEP_LOG --follow --since 6h
In the second example we demonstrate how to inspect logs of jobs submitted by Snakemake. There could be many such jobs, so we may restrict ourselves to, say, 5 jobs that have been running the longest. We first obtain all currently running jobs:
JOB_QUEUE={{JOB_QUEUE_NAME}}

RUNNING_JOBS=$(aws batch list-jobs --job-queue $JOB_QUEUE --job-status RUNNING)
We filter to include only jobs which are part of our execution (names of such jobs start with the execution name) and then select 5 jobs with the earliest start time:
EXECUTION_NAME=$(aws stepfunctions describe-execution --execution-arn $LATEST_EXECUTION --query name)

LONGEST_RUNNING_JOBS=$(                                                                             \
    jq -r ".jobSummaryList                                                                          \
        | map(select(.jobName | startswith($EXECUTION_NAME)))                                       \
        | sort_by(.startedAt)                                                                       \
        | .[:5] [].jobId" <<< $RUNNING_JOBS                                                         \
)
Now we can show the logs:
LONGEST_RUNNING_JOBS_LOGS=$(                                                                        \
    aws batch describe-jobs --output text                                                           \
        --jobs $LONGEST_RUNNING_JOBS                                                                \
        --query jobs[].container.logStreamName                                                      \
)

aws logs tail /aws/batch/job --log-stream-names $LONGEST_RUNNING_JOBS_LOGS --since 7d
You can inspect logs of succeeded or failed jobs in the same manner.
Cancelling the simulation execution
Recommended way to cancel the execution is to terminate the job corresponding to the simulation execution step.
GUI
In the graph view of the state machine GUI click on the execute simulation step and then click Batch job link (see the first figure). Locate the job termination button in the upper right corner and click it. This will trigger a clean up job that will terminate all outstanding jobs submitted by Snakemake.
CLI
aws batch terminate-job --job-id $EXECUTE_SIMULATION_STEP --reason "N/A"Obtaining the results
The results will be placed in the storage bucket, inside the directory specified in input JSON. You can continue processing the results using your AWS cloud infrastructure or you can download them to your computer:
BUCKET={{BUCKET_NAME}}

aws s3 sync s3://$BUCKET/examples/baby_mouse_example baby_mouse_example
Verify the results:
md5sum baby_mouse_example/results/*sam

c02704029f6e16a77ea6890ebf92375a  results/S1_L1.sam
35dca3ee057e7a8bac8b8a5d790b054f  results/S1_L2.sam
7c963445bab5153c63c87d507ba589aa  results/S1_unidentifiedL1.sam
00dcaa96464e2e207aa2989650d0b8f3  results/S1_unidentifiedL2.sam
e1b0b04a7e3ca9274b5fa59b03479f97  results/S2_L1.sam
4a7e526ea6b333b19ff40689f659e680  results/S2_L2.sam
19937368990e8bff3ed6b86a8a6718fc  results/S2_unidentifiedL1.sam
bef563a2384e92961bd9701e5f5e2720  results/S2_unidentifiedL2.sam